Rank Chart / Slopegraph for (car) racing data
Problem
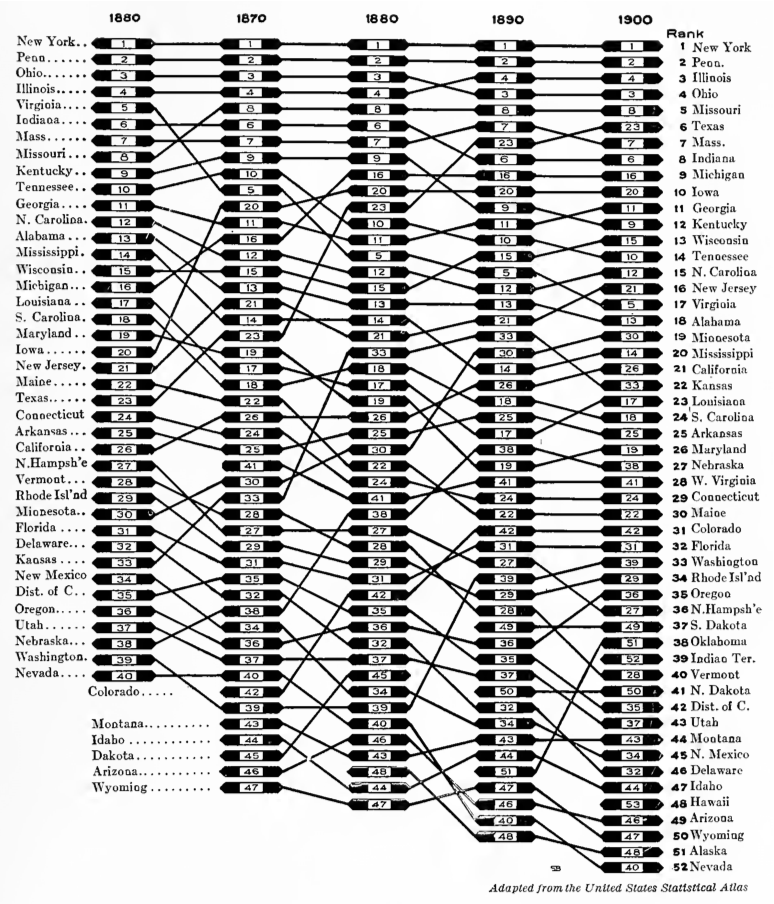
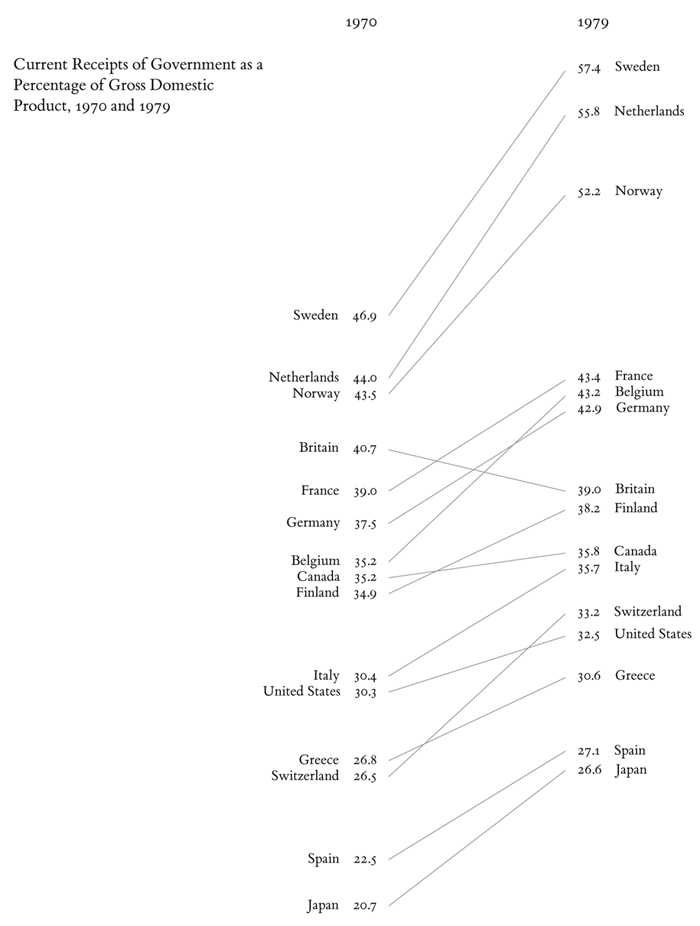
For representing positional changes within a set of elements, rank charts were already introduced in early statistical publications (see Figure 2.17). Elements are ordered according to their ranking and displayed next to each other in columns for different points in time. The positional change of individual elements is emphasized by connecting lines. This way, the degree of rank change is represented by the angles of the connecting lines, thus making big changes in rank stand out visually by the use of very steep lines.
Aim
Prototypical implementation of the Rank Chart / Slopegraph using an existing framework for interactive visualization of time-oriented data that is based on prefuse
Other information
- Eduard Tufte forum on Slopegraphs
- Blog post about Slopegraphs by Charlie Park
- Slopegraph implemented in D3
Information about prefuse:
InfoVis:Wiki
http://www.infovis-wiki.net/index.php?title=Prefuse
For beginners:
• Explore the demos in the online gallery http://www.prefuse.org/gallery/
• Download the toolkit www.prefuse.org
• Have a overview on the Prefuse classes
• Run the demos that come with Prefuse download.
• Read the user's manual: http://www.prefuse.org/doc/manual/ especially the introduction.
• Read and try out tutorials:
http://www.ifs.tuwien.ac.at/~rind/w/doku.php/java/prefuse-scatterplot
http://www.infovis-wiki.net/images/d/d7/Prefuse-tutorial-20061127-handout.pdf
http://www.cs.mun.ca/~hoeber/teaching/cs4767/notes/04-prefuse/
Die Javadoc API Documentation:
http://prefuse.org/doc/api/


